todayonchain.com

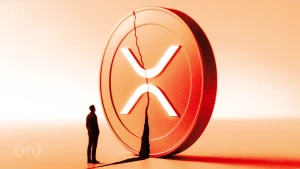
XRP Technical Charts Show Potential Drop to a Dollar

BeInCrypto
XRP displays a head-and-shoulders pattern on its daily chart, signaling a potential price decline to $1.00 unless key resistance levels are reclaimed.

Summary

XRP is currently exhibiting a bearish head-and-shoulders pattern on its daily chart, with a neckline support zone between $1.28 and $1.31. A confirmed daily close below this level could drive the price toward $1.00. While short-term accumulation is visible on the 4-hour chart, bulls must reclaim the $1.51 to $1.55 resistance range to invalidate the bearish setup. Despite potential catalysts like upcoming spot XRP ETF decisions, the immediate market structure favors a cautious outlook unless a clear breakout above $1.44 occurs.

(Source:BeInCrypto)